Logging, Tracing, Monitoring, et al.
15 min readSo, you want to launch your code/app/system in production?
Wait, before you do, ask yourself this question: If something goes south, how will I know what exactly happened?
A good question, indeed.
A more seasoned engineer might say: I will use logs!!! But what if I tell you, logs are only the begging?
[Disclaimer Time] This article is not about some concrete technology, framework, or library, although it references some of these. It’s more of an overview/tips about what logging/tracing/et al are and how to approach these when designing and operating software systems. The information here is based mostly from my own experience, but also from information available in papers and industry blog posts. You might need to google some stuff while/after reading it, especially if you’ve never operated a system running in production.
Act 1: I’ll set up logs, alright…
So, what exactly is a log?

Technically, this is a log, but I want to talk about other kinds of logs.
Logs are a record about some event in a system
Pretty abstract, huh? A log is like an entry in a journal about something that happened, maybe with some context. Somewhat like the Twitter feed of an Apple-reporter during the WWDC event. You have time, you have a record of something that just happened, and maybe you have context too. Now, jokes aside, logs are necessary for a system running in production. They help you uncover what was happening moments before applications crash. Or malicious activity. Or other stuff. But how do we make good logs?
Tenets of a good log message
So, how should we design our logs? Here are some tenets:
-
Thy logs must be hierarchical: we need to respect the distinction between
DEBUG/INFO/WARNING/ERRORand possibly other levels. We should not crowd the system withWARNINGlogs whenINFOorDEBUGlogs are more appropriate. Crowding also refers to how much information a log contains. That said, a good idea for anERRORlog is to register as much information as possible to aid in debugging. UseDEBUG-level logs to register information about what setting the program is using, even how much time or resources some subroutine is using, but don’t abuse this. As forINFOlogs, anything in between. Like information about a call to a top-level route handler in an HTTP server. Also,INFOlogs are the right way to use prints in a system. -
Thy logs must be informative: A good rule of thumb is to log everything that might help you debug your system. If an error happens, you will want to log the traceback. Also, logging the context in which the error happened will prove to be useful. By context, I mean some surrounding variables, which might have something to do with the failure. If your system is running with multiple processes or is multithreaded, or multi-whatever, do yourself a favor and log the PIDs/Thread IDs. Finally, be very careful with how you represent time, explaining why would require an entire blog, but time in computer systems is a pain, see for yourself.
ERROR: Error name, message, traceback, variables in scope is possible
WARNING: Warning name, message
INFO: Calls to top-level functions/handlers, like: [2021-05-17 00:06:23] INFO: GET /posts 200 OK
DEBUG: Program setup/initialization info, possibly memory or performance information*

*: more on that later
- Thy logs must be filterable: logs are meant to be analyzed. Make them as searchable as possible. Consider formatting them as JSON documents, and don’t abuse nesting.
Why not? If the JSON is too nested, it becomes hard to search/analyze, defying its purpose.
For example, Elasticsearch can’t properly index JSONs with two or more levels of nesting. That is, something like the example below can be indexed:
{"timestamp": "2021-05-18T21:09:54Z", "level": "error", "msg": "bad thing happened"}
Even something like this:
{"timestamp": {"date": "17th May, 2021", "time": "11:30:30am"}, "level": "error", "msg": "bad thing happened"}
But do something like this:
{"timestamp": {
    "date": "17th May, 2021",
    "time": [11, 30, 30, 124]
    },
 "level": "error",
 "msg": "bad thing happened",
 "context": {
    "some_key_for_multiple_values": []
    }
}
And Elastic will treat your deeply nested elements like strings, and then good luck filtering and aggregating these logs. So keep it flat, whenever possible.
Another good format is NCSA Common log format, but if possible, choose JSON. Why? Most log analysis tools use JSON. Something like NCSA Common log format is better for smaller systems, where you can search your logs with grep and friends. Finally: Whatever format you choose, be consistent across your whole system
Bad log (1): [2021-05-17 12:30:30] ERROR: KeyError // JSON version would be just as bad
Bad log (2): {"datetime": {"date": "17th May, 2021", "time": "11:30:30am"}, "type": "ERROR", "msg": "A KeyError error occured in function some_function"}
Better log: {"timestamp": "2021-05-18T21:09:54Z", "level": "error", "pid": 1201, "traceback": <your traceback as a string>, "msg": "KeyError: 'key_name'"}
Some wisdom on logging ops
So you have well-written logs. That’s great!!
But now you have to decide how to access and analyze them. Funny thing, these decisions should also be guided by the stage and the scale of your system. In other words, I would advise against a complex infrastructure if you have one app serving a few hundred people.
Now we should dive into details.
You will roughly have three stages.
- Log collection/shipment
- Log storage
- Log processing/analytics
First, log collection. We want to save our logs somewhere and not just let them print to stderr/stdout. So, now we have to think about where do we write them. It could be a file, or to Syslog, for example, or we could even write them into a TCP or UDP socket, sending them away to some logging server. To be honest, all choices are somewhat good. As long as you don’t block the thread where the action happens, you should be fine, otherwise, prepare for a performance hit.
Regarding storage, for a simple app leaving them in file format should work for a while, but eventually, a storage solution with indexing support or really anything that can help you quickly search your logs will be advised.
Once you have multiple services, you can think of a centralized logging server, something like an ELK (Elasticsearch, Logstash, Kibana) cluster, with one or a few Elastic instances in a cluster setup.
So here comes my personal opinion: you should start by logging into a file, and mandatory ensure log file rotation because you don’t want a single 10GB text file. Believe me… you don’t. At some point, you will also have to think of log compression and possibly log shipping. Log shipping means transferring the logs from where these were created to where these will be analyzed and stored for a long time.
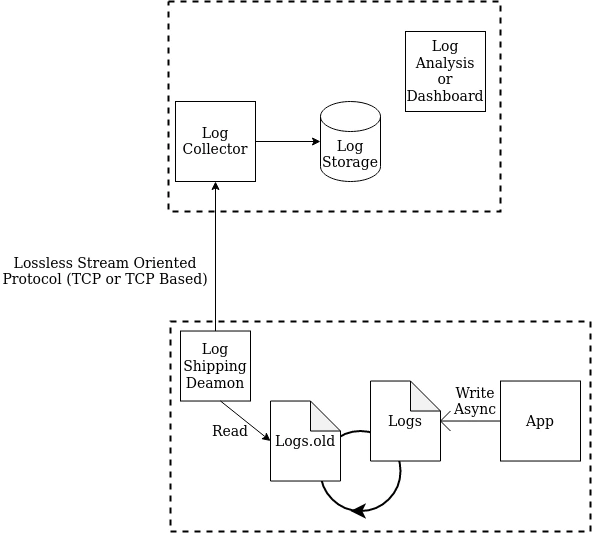
When it comes to log shipping, I would strongly suggest using TCP or HTTP over UDP and other protocols. Why, you may ask? Because first of all, with UDP you might lose logs while transferring them due to (1) no way of retransmitting lost packets, (2) no flow control, which might be the cause of lost packets, but also because with UDP message size is limited to 65KB of data, or even less, depending on network settings, which quite frankly could be not nearly enough. Also, your company firewalls might block this kind of traffic. So, a lot of trouble.
Having a centralized logging solution, you will now absolutely need to ship the logs, and having them first written to a file will prove a very nice idea because now your logs won’t be lost in case of network outages, server failure, logging system failure or any of the above mentioned being too slow.
Nice.

Act 1.1: Hey, I think I can make a chatbot to notify me when something blows up
Yup, you can. And if you want to reduce MTTR you most likely should. Just take into account a few things.
- First and foremost, if you have the possibility, set up alerting thresholds. You don’t want to be notified when something is even slightly off every. single. time. Maybe it’s some unique (non-critical) event, no need to bother, while if the issue happens frequently, you better be notified.
- Another consideration, when it comes to alerting, is the possibility to have escalation alerting. First, send an alert via email. If no action was taken, now send it to a chat group of the responsible team. Still no activity? Send it in DM to an engineer, or even to a technical manager.
- Finally, just aggregate the stuff, no need for 12, or a hundred, emails/Slack messages of the same issue. Something like one log message and then some text like
X occurred 25 times in the last Y secondsshould be good.
When it comes to what tools to use for alerting, well, you have Sentry, also to my knowledge, it is possible to set up alerting in Kibana, although I don’t know whenever this is a paid option or free, and there are of course other tools.
This is by no means a definitive guide on how to do it, only some things to keep in mind. This whole blog post isn’t a definitive guide if you haven’t noticed yet.
Act 2: My system is slow, I guess I’ll log execution time, and # of requests, and …

… just. Stop. Please. The fact that you can do it, doesn’t mean you should. Welcome to the world of telemetry and performance monitoring, where you will initially wonder, why not just use logs? I mean, in principle you could do this, but better to have a different infrastructure, to not mess everything up.
Mess up how? Well, if you’re like me, you might want to set up performance monitoring not just at the route controller level, to see how much requests take to be handled and responded to (assuming a hypothetical server). You will also want to track how much time queries to the database take to execute, even functions! And now you have a ton of very fine-grained info, which will for sure overload the logging infrastructure. You don’t want that. Besides, even if all runs smoothly, your read and write patterns will be different. Log analysis queries can be much more complex than analysis required for performance monitoring. Also, performance monitoring usually has smaller messages that need to be recorded with lower latency. All in all, better set up a dedicated infrastructure for this.
The easiest thing is of course to use TRACE level logging, and as said earlier, dedicated infrastructure for performance monitoring. But this works only on small scale, where frankly, you don’t even need performance monitoring.
As the system scales, you might start looking towards a more restricted type of logs, maybe some binary protocols, given that you will be sending small packets of information right away, very frequently.
Performance monitoring has a bit of a different write and query patterns than log analytics (ik, said it earlier), so different storage is recommended. Queries are simpler mainly showing trends, time series, current values, or some simple aggregate values, like counts, means, medians, and percentiles, and writes are very frequent but with little data, only a few metrics, compared with logging tracebacks and contexts and stuff like that.
That’s why for example ELK stack is more common in logging infrastructure, where Elasticsearch can index and analyze even very unstructured data, and stuff like Grafana + Prometheus are more commonly used for performance monitoring. Prometheus, among other things, contains a time-series database, just the right thing to store and quickly query performance metrics.
Also, when it comes to performance analysis, you will want to monitor your system utilization, not just the stuff intrinsic to your code. If you’re using Prometheus, that’s easy to do.
Act 3: My microservice system is slow, but I can’t figure out why
First, a likbez (crash-course) on networking and dynamic systems: Against our intuition, a computer network is a shared resource with a limited capacity. This basically means if one service is very chatty, it will influence the throughput and latency for all the rest. Also given that networks are a priori not 100% reliable and we mostly use TCP-based traffic, in the network, there will be plenty of packets (chunks of data, retransmissions, packets from administrative protocols). That’s only half the problem though. There’s more 😉
Our services are dependent upon each other and upon 3rd parties. So if one service is slow, it might influence other services, even ones that are not directly interacting with it. One metaphor to help you think of it is a spider web. When you touch it on one side, it will ripple on the other side. Kinda like a butterfly effect. And that’s not just a simple comparison, you could indeed see failure due to some other service being somewhat slower.
So, how do we monitor this?
Maybe logs? Or something like performance monitoring from the previous act?
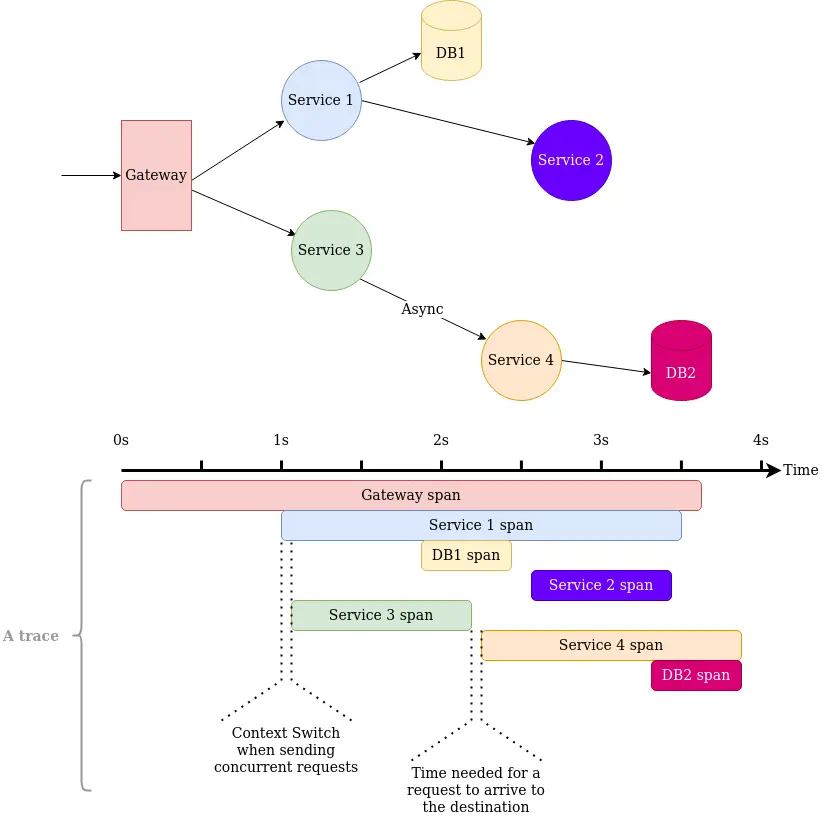
Well, I mean, it’s a start, but only logs won’t cut it. Because we don’t see the full picture, specifically, we don’t see the interaction between services, only each individual’s performance. We need something more. Enter tracing.
First, a good mental model about tracing is that it’s like logging, but with a correlation identifier, which makes it possible to combine said logs into a “trace”. A trace like this now can show us how, for example, a single request spans multiple services, how much time does each step takes and even how much time was spent on communication. All this can help uncover bugs and performance bottlenecks which a simple performance monitoring tool, or just logs, won’t be able to do. Tracing will help you find bottleneck services, and sometimes even aid you in debugging distributed systems.
Traces should be thought of as an extension to performance monitoring tools, rather than logs. Traces’ primary purpose is to uncover performance issues, also sometimes pinpoint the reason a specific operation failed. You could use them as logs, but don’t overload them with information, otherwise, your collection, storage, and analysis infrastructure will cry.
How to structure your traces? The easiest thing to do is to use tools that automagically will patch your dependencies like database clients, web servers, and HTTP/RPC clients and be done with it. Sensible defaults, you know. If you want to have more control, be prepared to write some boilerplate, especially if you want to manually control what things will be propagated between services. When it comes to adding info to your spans (the pieces which combined form a trace) don’t add your whole application context, only the most important things, for example, current configurations of your system.
Side note, sometimes it is important to correlate traces with logs, for this you can use yet another correlation identifier, for a more in-depth analysis of your system, combining traces with individual logs.
There are some existing Open Source tools with great support, like Jaeger and Zipkin, there are also industry initiatives like OpenTracing, OpenCensus and “their combination” OpenTelemetry, not to mention a few trace formats, like W3C Trace Context and Zipkin B3 formats.
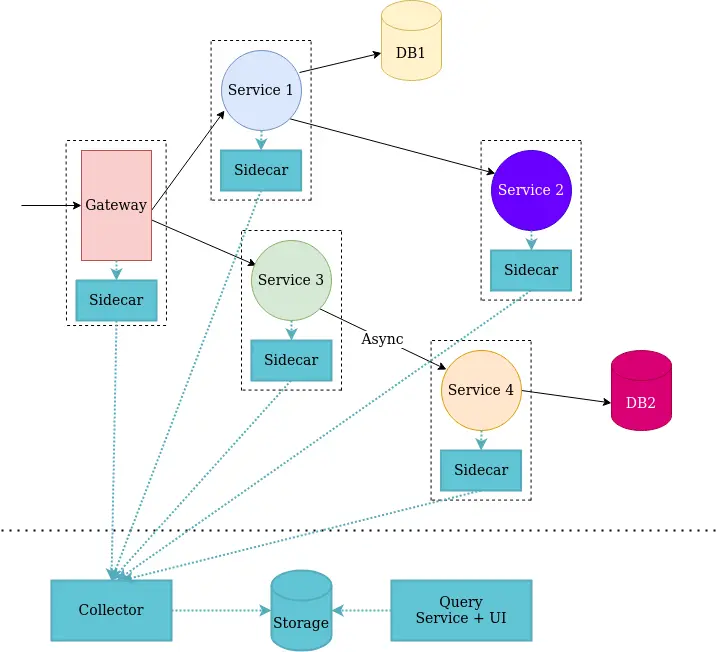
A common architecture for tracing subsystems is a combination of a sidecar, collector, storage, and “presenter” components, not to mention the client library. When it comes to using tracing in a serverless setup it gets tricky, one solution would be to bypass the sidecar and send data directly to the collector, but you will lose some nice features.
Tracing, in general, is huuuuge topic, and covering it would require at least one more long-read article. That’s why, for more information, I’d like to point you towards these two articles and this post from Uber. In these you’ll find more “war stories” on how such systems where implemented (first article and the post from Uber) and also such important topics as trace sampling strategies and trace visualizations (second article).
Final act: Welcome to observability!!!
Observability, what?
Observability is the property of a system to be understood. It’s a property of how well can one infer the internal state of something from its external outputs. It’s a spectrum and depending on where your system stands, you can use monitoring and alerting more or less efficiently. In other words, if a system is observable you can understand what is happening within it from its outputs.
We need to design our systems with observability in mind. And with all the stuff outlined above, that should become a doable task.
I prefer to think of observability, with a proper incident response procedure, of course, as a way to make said system anti-fragile (see the works of Nasim Taleb), because with every failure and issue that happens, it “learns”, on the organizational level, to be better. Or one could argue that on the contrary, the system now becomes more fragile because with every fix we believe more and more that the system is now unkillable, which it never will be.
Pick for yourself, but don’t forget to use logging. At least you’ll know when and why things go south, and that’s something.
Epilogue
You’ve made it! Congrats! Now you have some very important knowledge of how to be prepared when manure hits the proverbial fan in production. This knowledge should help you debug even super-obscure bugs. Of course, this isn’t going to be easy, plus you now have an entire infrastructure to take care of, but hey, if this helps reducing time to solve an issue from 1 week (or more) to 1, maybe 2 days, it might be worth it.
I know for a fact that it was worth it for me, time and time again when it helped me quickly identify edge cases, stupid misconfigurations, and performance bottlenecks.
So yeah, that’s it for now. Incredibly, it didn’t take much time since my last blog post.
Finally, if you’re reading this, I’d like to thank you. Let me know what are your thoughts about it via Twitter, for now, until I plug in some form of a comment section. Your feedback is valuable for me.