Going beyond simple error analysis of ML systems
20 min readFirst, there was a story…
Imagine yourself working as an ML engineer… very cool my friend!
First of all, congratulations, pat yourself on the back, your family must be proud.
Second, depending on the company size, culture, and the maturity of the machine learning team, you’re most likely in for a wild ride through many computer science and software engineering domains.
Again, pat yourself on the back. Now, let’s get to the chase.
As an MLE, part of your work is to pick, tune and deploy ML models. I believe I don’t need to explain to you that this is not so trivial. You must believe that the hard part of this process is to tune the model, don’t you? Or maybe that it is the deployment of the algorithm? Although these are indeed non-trivial, especially the later one, here’s The Question © for you:
How do you make sure you have a high-quality model in production?
If you’re gonna tell me that you just tested your model on a held-out dataset and that your metric of choice was something like accuracy, or the mean squared error, just run. Fast. Far away. If you didn’t run, be prepared to be questioned whether or not you:
- had a baseline,
- balanced dataset or adjusted your metrics,
- used the held-out dataset for tuning/hyperparameter search … and so on.

I guess you figured out by now that a simple train/test split and a few error metrics, like accuracy or maybe even F1*, are not nearly enough to answer The Question ©. But what would be enough? Well, it depends, like all things in software engineering. You need to understand that reducing your model characteristic to only one or a few scalars will forfeit way too much information about the model.
* F1 score is a much better choice, btw
… and then words of wisdom* followed
* - more like personal war stories
Disclaimer, this is a long post, so maybe brew some tea/coffee, get a snack, you know, something to help you get through the whole thing. Maybe taking notes would help you to stay focused. It certainly helps me when reading a lot of technical text.
Another little disclaimer: I had an older post tangential to this topic, but the focus in it was on interpretability/explainability methods. In this blog post, I focus more on how to assess the errors of machine learning models. If you think these topics are pretty close to each other, somewhat overlapping, you are right. To better evaluate a model, we sometimes need to understand the “reasoning” it puts into making a prediction.
Keep in mind - depending on the domain you apply machine learning to, a subpar model could be anything from a little annoyance for your users to a complete dumpster fire that amplifies biases and makes your customers run away from your business. While it could be easy for said users to opt out from the former, the latter can ruin your business. We don’t want that. Your employer certainly doesn’t.
Ok, copy that. But how do you know that a machine learning model is good? Do you need to understand its predictions? Does your use case have a specific group of users that you care about the most? These questions can help you derive an evaluation strategy and in turn to make sure nothing goes south after you deploy an ML model.
You know what, let me first define a few ML evaluation maturity levels. It will be easier for me to explain and for you to follow along. For now, don’t bother about the meaning of some more advanced terms here, I will explain them right after this section.
- Level 0 (L0): Having a train+test split and one or two generic metrics, like MSE or Accuracy. At this level, deploying the ML model is not advised (read: irresponsible at best).
- Level 1 (L1): Previous level, but using cross-validation if possible, or worst-case scenario, having a big and diverse test set. You will need to have per-class metrics for classification problems or multiple metrics for regression problems. For classification use cases, metrics like ROC-AUC score, or F1 score are considerably better than accuracy, so use these. Moreover, understanding your model’s precision and recall characteristics can prove crucial for a successful ML product. In case of regression, MAPE+RMSE+Adjusted R^2 are a good combination, you can consider using AIC and/or BIC too. For regression, try to have at least one metric robust to outliers (MAPE is robust to some types of outliers, but not the others).
- Level 1.1 (L1.1): Check most wrong predictions, that is, entries with high prediction confidence, but that are predicted wrong. It can help you uncover error patterns, maybe even biases.
- Level 2 (L2): Perturbation analysis using counterfactuals and random alterations of input values. Usually, such an approach permits an understanding of feature importance for each entry, but that is more like a bonus you have to work to get.
- Level 2.1 (L2.1): ICE/PDP/ALE plots can be used to better understand feature importances. Keep in mind these are fairly compute power demanding.
- Level 2.2 (L2.2): Surrogate local explanations (usually LIME) and/or additive feature explanations (i.e. SHAP) to understand model predictions before approving the model for deployment. Also computationally demanding.
- Level 3 (L3): Cohort-based model inspection. One way to define cohorts is through Manifold-like error groupings. At this level, it’s important to acknowledge the changes in data distributions and if applicable, to evaluate on data from different periods. Believe me when I tell you this, sometimes feature and/or label distributions can change even in domains where you don’t expect them to. And not accounting for this will give you some royal headaches.
- (Optional) Level 4 (L4): Adversarial examples checking. Stuff like Anchors and TCAV are at this level too. In principle, any other advanced model interpretability/explainability or security auditing is at this level.

You would want to be at Level 1 when launching a model in beta, Level 2 when it’s in production, and from there grow to Level 3. Level 4 is more specific and not every use case requires it. Maybe you are using your ML algorithms internally, and there’s a low risk for some malicious agents trying to screw you, in this case, I doubt you need to examine the behavior of your model when fed adversarial examples but use your own judgment.
Note that although I mention regression use-cases, I omitted a lot of info about time-series forecasting. This is done on purpose, because the topic is huge, and this post is already a long-read. But if you have a basic understanding of what’s going on here, you can map different time-series analysis tools onto these levels.
Methods
Let’s roughly cluster evaluation/error analysis methods into three broad categories: (1) metrics, (2) groupings, and (3) interpretations. Metrics is kind of obvious. Groupings are probably the most abstract ones. We put here train/test splits, cross-validation, input data cohort, and error groupings in this… oh god… group (no pun intended). Finally, under the interpretation umbrella fall such things as surrogate local explanations, feature importance, and even analyzing the most wrong predictions, among other things.
Metrics
I won’t dive deep into metrics-based evaluations but will mention that depending on your use case you might want to consider metrics that are non-linear in their relation to how wrong the prediction is. Maybe you’re fine with a bit of error, but if the model is very wrong, or frequently wrong, you want to penalize it disproportionally more. Or, on the contrary, as there are more wrong predictions, or the total loss of the model is growing, you want to have a log-like behavior for your metric, i.e. the metric will attenuate its growth as the model is more wrong.
Furthermore, on the matter of metrics that are robust to outliers, sometimes these are nice to have if you do some outlier removal beforehand. Or there might be a necessity, in cases when you can’t or specifically don’t remove the outliers, for whatever reason. Keep that in mind.

Usually, in production scenarios, you will want to assess your model performance on different cohorts, and maybe even based on these cohorts to use different models. A cohort means a group of entities, with a specific grouping criterion, like an age bracket, or location-based, or maybe something else.
Groupings
I mentioned cohorts in the paragraph above, so it will make sense to follow up on this. Cohorts are important because your stakeholders are interested in these, sometimes you might be too, but the business is usually the number one “fan” of cohorts. Why? Well, it could be due to many reasons. Maybe they are especially interested in providing top-notch services for a special group of customers, or maybe they must comply with some regulations that ask them for a specific level of performance for all the users.
Moreover, your dataset is most certainly skewed, if it’s real-world data. Meaning, you will have underrepresented classes, all sorts of imbalances, and even different distributions for your features for each class/group of classes. For example, it wouldn’t be ok for any business to give subpar recommendations for users outside the North America region, or to predict that a person of color is some kind of ape.
We need to create cohorts, or groups, based on some characteristics, and track the performance of our machine learning systems across these. Often you will discover that the teams who are conscious about their cohorts will deploy different models for different user groups, to ensure high-quality service for everyone.
But groupings aren’t just cohorts based on input data characteristics. Sometimes for model analysis, it makes sense to create groupings based on errors. Some kind of groupings by the error profile. Maybe for some inputs your model(s) gives low errors, for other inputs some very high errors, and for yet another group the error distribution is entirely different. To uncover and understand these, you could use K-Means to cluster your losses and identify the reason your model might fail or just underperform. That’s what Manifold from Uber does, and that’s just brilliant!
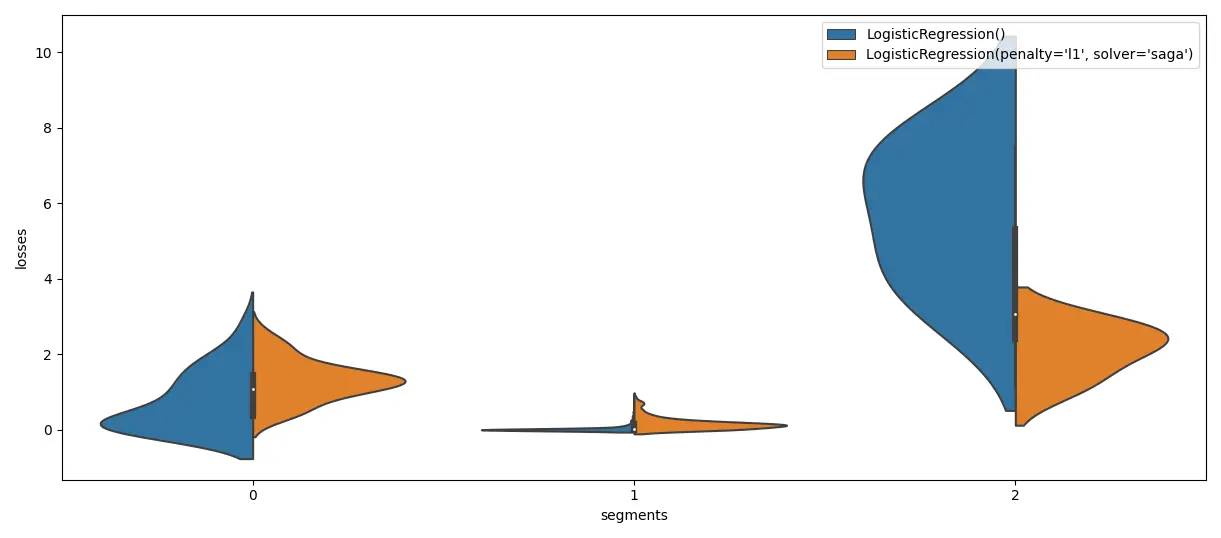
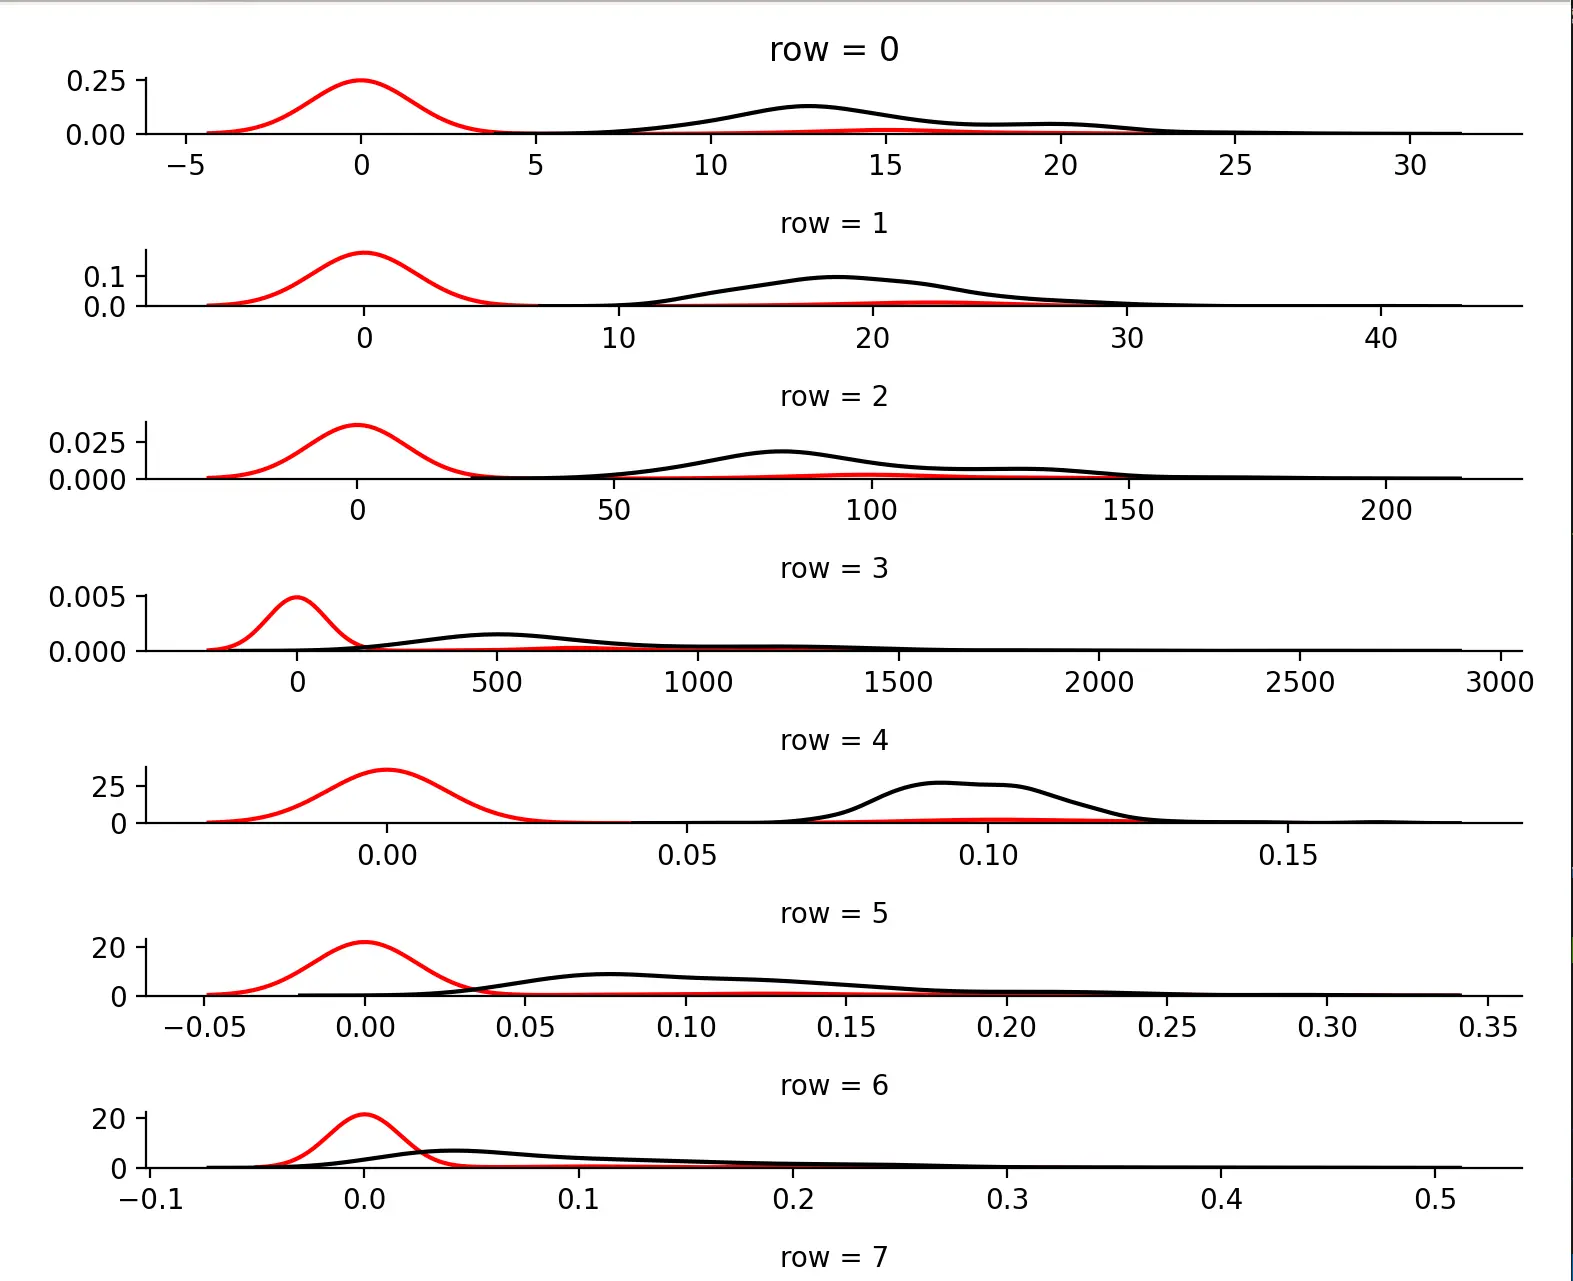
Source: The author. Inspired by: http://manifold.mlvis.io/.
Finally, groupings are also about how you arrange your data into training and testing splits. Or more splits, like evaluation during the training of your model. These help in noticing when the model starts to overfit or whatever. Keep in mind, special care should be taken when doing a hyperparameter search. For fast-to-train models, a technique called nested cross validation is an incredibly good way to ensure the model is really good. The nested part is necessary because doing hyperparameter optimization (HPO) you’re optimizing on the evaluation set, so your results will be “optimistic” to say the least. Having an additional split could give you a more unbiased evaluation of the final model. What about slow models? Oh, boi. Try to have a big enough dataset such that you can have big splits for all your evaluation/testing stages. You don’t have this either? Have you heard about the AI hierarchy of needs?
Also, an often overlooked issue is the target distribution of the dataset. It might be heavily imbalanced, and as a result, special care should be taken when sampling from it for train/validation/test splits. That’s why you should almost always search for a way to have your splits stratified (see scikit-learn’s StratifiedKFold, also train_test_split has a stratify= parameter and for multioutput datasets check out multioutput_crossvalidation package). When a dataset is imbalanced you could try to do some sort of oversampling, a la SMOTE or ADASYN, but in my experience, it might not always work, so just experiment (a scikit-learn-like lib for this is imbalanced-learn).
Interpretations
Disclaimer #2, this part of the blog post is maybe one of the most overwhelming. There’s quite a body of literature about ML interpretability/explainability and I will only briefly mention some methods, for a more in-depth overview, check out Interpretable Machine Learning by Christoph Molnar.
This category is pretty abstract, and some might argue that these are not really related to model evaluation, but rather ML interpretability/explainability. To which I say that these methods allow uncovering hidden errors, biases. Based on these, now you can pick one model over another, thus interpretations being useful for evaluation. These tools excel in identifying the “right answer - wrong method” scenarios, which will pass without any issue metrics and groupings.
So, what things can you “interpret” about a model that can help you evaluate it? First, if your model/API allows for it, you could check feature importances. You might discover that a model puts too much weight on some obscure feature or one that doesn’t make sense. At this point, you should become a detective, and find out why is this the case. This kind of feature importance is called global feature importance, because it is inferred at the model level, from all training data.
The next easy thing to do is perturbation analysis, of which there are multiple categories. Perturbation analysis means altering the input and seeing what’s going to happen. We can alter the input with a different purpose to assess different aspects of the model.
- Counterfactuals, aka “What if I change this one feature, how will my model prediction change?”. We can check for example how sensitive is the model to changes that in principle should change the prediction intuitively. A prominent tool for this is Tensorboard’s What-If tool.
- Adversarial examples, aka “Can I create such input that while similar to a normal one will result in a messed prediction”. Checking these is usually important for external user-facing systems, where an attack can have very nasty consequences, and because this kind of verification is more specific, it is usually left for later during the project.
- Random alterations, to assess how robust is the model to unimportant changes, or how well it captures “common sense-ness”, also can be used for local feature importance. In the case of a sentiment analysis problem, a random alteration could be swapping synonyms for words that don’t have positive or negative semantics, aka neutral words.
- Out-of-distribution data. Ok, this one isn’t really perturbation analysis, but sometimes you want to make sure the model can generalize to data that is similar but not quite. Or maybe you just want to have some fun at work and pass german sentences to a sentiment analysis model trained on Spanish text.
Another way to help you uncover error patterns is by checking the wrong predictions which have very high model confidence. In simpler terms, the royal fuck-ups. I learned this method relatively late, from the Deep Learning Book by Goodfellow et al. I’m lazy, and this method although obvious in hindsight, is new to me. I prefer doing perturbation analysis so that there’s no need for pretty printing and/or plotting with that one. But while working on my research project I am now “forcing” myself (it’s not so bad, really) to also do this step.
I would recommend defining some sort of regression tests suite made up of previously problematic input examples. This can help be sure that future versions of the ML model are indeed an improvement on the previous ones. In it can check previously wrongly classified entries or use examples from different types of perturbation analysis. You will thank yourself later for this regression suite.
Surrogate local explanations, of which the most prominent tool is LIME, are another kind of interpretability tool. Surrogate local explanations try to approximate a complex machine learning model with a simple machine learning model, but only on a subset of the input data, or maybe just for a single instance.
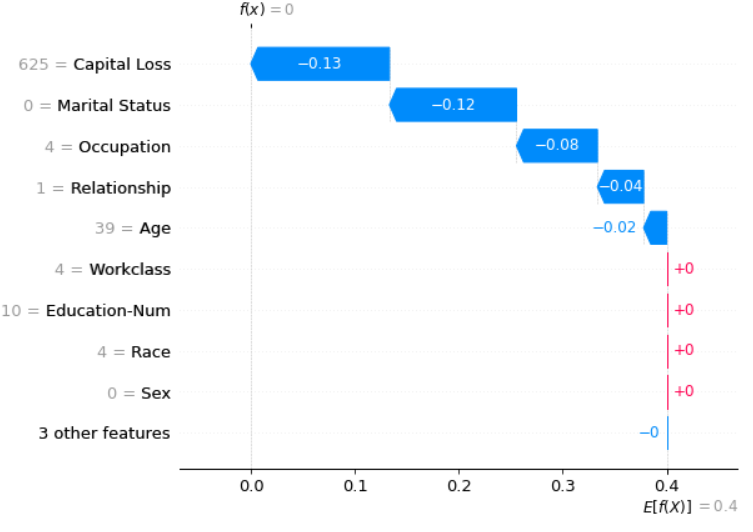
FINALLY (now for sure), another notable class of ML interpretability methods is additive feature explanations, and for this category one of the most prominent tools is SHAP. SHAP is especially interesting, albeit harder to understand, given it’s based on game theory and uses Shapely values to define local feature importances. One issue with this method is that Shapely values or almost any other additive feature explanation method don’t account for feature interactions, which can be a deal-breaker.
There are even more advanced tools, tuned specifically for neural networks. These use different forms of saliency or activation maps. Tools like these are cool and helpful, but harder to use, and not as general. Trying to cover even a subset of these would require an entire book, so if you’re interested, you know what to do ;). In the book, you can find much more detailed explanations about modern tools like SHAP, LIME, Anchors, but also more classic approaches like PDP, ICE, and ALE plots. And even concept identification approaches like Tensorflow’s TCAV tool.
One thing to keep in mind, interpretability tools are crucial for a proper model evaluation. Although not a direct mapping, you can think of these interpretation methods for a model like code review for code. And you don’t merge code without code review in a production system, now do you?
Personal recommendations
We’re nearing the end of this post, so I would like to give you some recommendations on how to proceed when evaluating ML models as if those maturity levels weren’t enough. These recommendations are more low-level and practical, some gotchas if you will.
- Of course, start with a couple of appropriate evaluation metrics. Don’t use just one. If you can, cross-validate. If doing HPO, have two testing splits. For classification, I would recommend at least some loss and some score function + scikit-learn’s
classification_reportand if you don’t have a ton of classes, the confusion matrix is your friend. Some people use AUC and Precision-Recall curves, which are nice, but I’m just not used to these. Maybe after this blog post, I will start using them. (do as I say, not as I do) - I usually do perturbation analysis (random and counterfactuals) after this. Looking for the top-k most wrong predictions helps, but I rarely do it (do as I say, not as I do, #2).
- If I’m not satisfied yet, I will certainly check for error groups a la Manifold and/or surrogate local explanations (LIME-like, I mostly use the
eli5package). I prefer not to do the latter because it takes a looooot of time, especially with bigger-sized input. Regarding local explanations with surrogate models, sometimes I find it necessary to adjust the surrogate using the default might be just too simplistic. I do NLP, so both points are a real issue for me.
Sometimes, especially in the early stages of development, I could do a kind of “exploratory testing” of model predictions, namely feed out-of-distribution data and look at what will happen.
For personal experiments, I can sometimes use SHAP but I find it a bit frustrating that it’s hard to export the graphics and that it works best when working from Jupyter. Moreover, it’s slow, but that’s a general issue for all surrogate explanations.
I am yet to play around with Anchors, adversarial examples, and doing stuff like “Find the most similar entry with a different class” or “Find the most similar entries to this one”. The latter two can be done using kNN in either feature, embedding, and/or prediction spaces. Microsoft Data Scientists seem to be asking these kinds of questions to assess their models.**
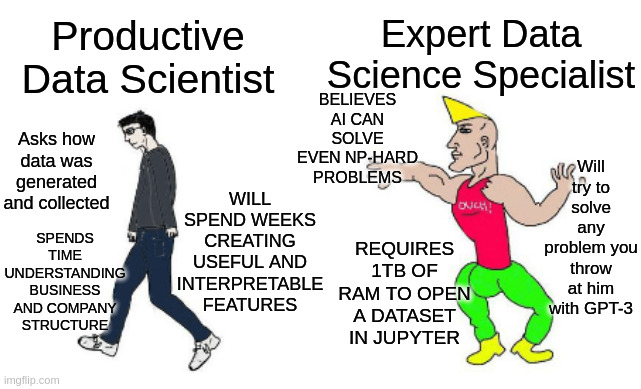
In the end, I am sure this amount of information is overwhelming. That’s why maybe the best recommendation I could give is to just use a simple model, one that is easy to understand. To make it performant you could also try to invest time in features that make sense. All in all, just be the data scientist your company needs you to be, not the one you want to be. Boring and rational beats hype-driven.
Epilogue
Probably this post, like no other, helped me crystalize a lot of the tacit knowledge gained through the years. Maybe you’ve heard the quote - “When one teaches, two learn” I believe something like this happened here too.
I know my posts are usually long and dense, sorry, I guess, but on the other hand, now you don’t have to bookmark 5-10 pages, just this one 😀😀😀 jk. Anyway, thank you for your perseverance in reading this article, and if you want to leave some feedback or just have a question, you’ve got quite a menu of options (see the footer of this page for contacts + you have the Disqus comment section). Guess it will take a while until next time.
 vvvvvvvvvvvvvvvvvvvvvvvvvvvvvvvvvvvvvvvvvvvvvvvvvvvvvvvvvvvvvvvvv
> Until then, you can play around                                <
> with most of the methods described in this blog post            <
> by checking the link below                                      <
> https://github.com/AlexandruBurlacu/error_analysis_code_samples <
  ^^^^^^^^^^^^^^^^^^^^^^^^^^^^^^^^^^^^^^^^^^^^^^^^^^^^^^^^^^^^^^^
You can also click on it here. All examples are seeded, so it should be possible to reproduce everything. Have fun.
Acknowledgements
Special thanks to @dgaponcic for style checks and content review, thank you again @anisoara_ionela for thorough grammar checks, and thank you @dianaartiom for the last bits of feedback on ML. You’re all the best <3
A few references
- A detailed overview of regression metrics
- Interpretable Machine Learning by Christoph Molnar; amazing work, a lot of info, a lot of details
- **Gamut paper to help you ask the right questions about a model
- Manifold paper and Manifold GitHub repo
- A good overview on how to evaluate and select ML models
- Github repos which also contain links to their respective papers:
- And an Awesome GitHub repo on different XAI tools and papers.